“My 2021” has been incredible. I had many wonderful moments, at personal, community and professional levels.
These below are some of my highlights.
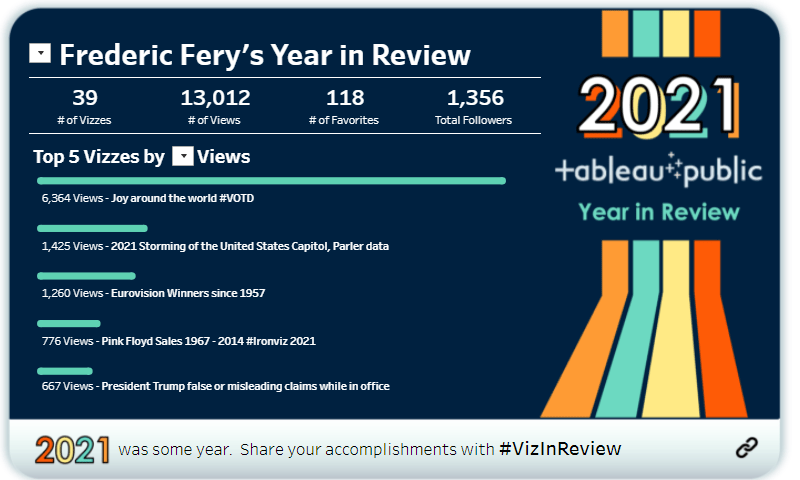
Viz for Social Good (First year as Director of Operations)
I’m really lucky to help advance data for good with Viz For Social Good. As Director of Operations “my job” is to help find orgs, schedule and organise projects for our volunteers. The VFSG Leadership team is incredibly supportive and the community of volunteers is soooo awesome too. This year we ran 5 projects (5th currently running and not on screen shot), we had incredible data stories and great outcomes for the organisations.
Many of our volunteers are first timers, students or beginners, from all over the world, using various data viz tools.

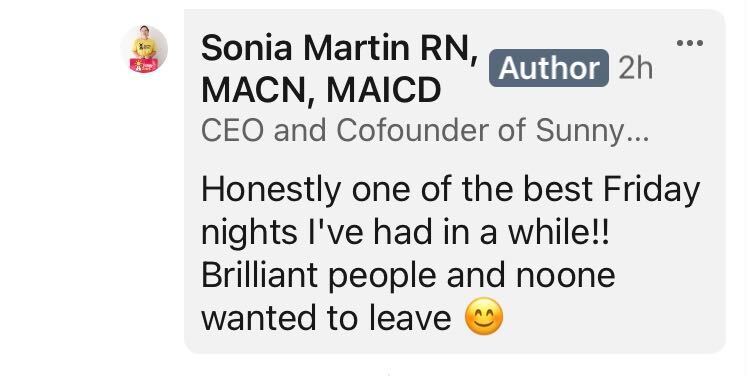
One top moment was with Sonia, the CEO of Sunny Street. At the end of each projects, we ask our top five volunteers (selected by the charity) to present their work. Unfortunately Sonia feel ill on the day, but we still had volunteers present their data stories. I then scheduled a second session two weeks after with Sonia (much better this time) and the five volunteers, and I think that was my best (dataviz related) night.
This quote below from Sonia summed it up. The interactions between Sonia and the volunteers was incredible, goosebumps like incredible. Doc Kevin (who was MCeeing the event) and myself really felt the deep connection.
Great collab too!
I had lots of fun carrying the Viz For Social Good flag at various forums, user groups. This session with Thi for Tableau Live APAC was really great!
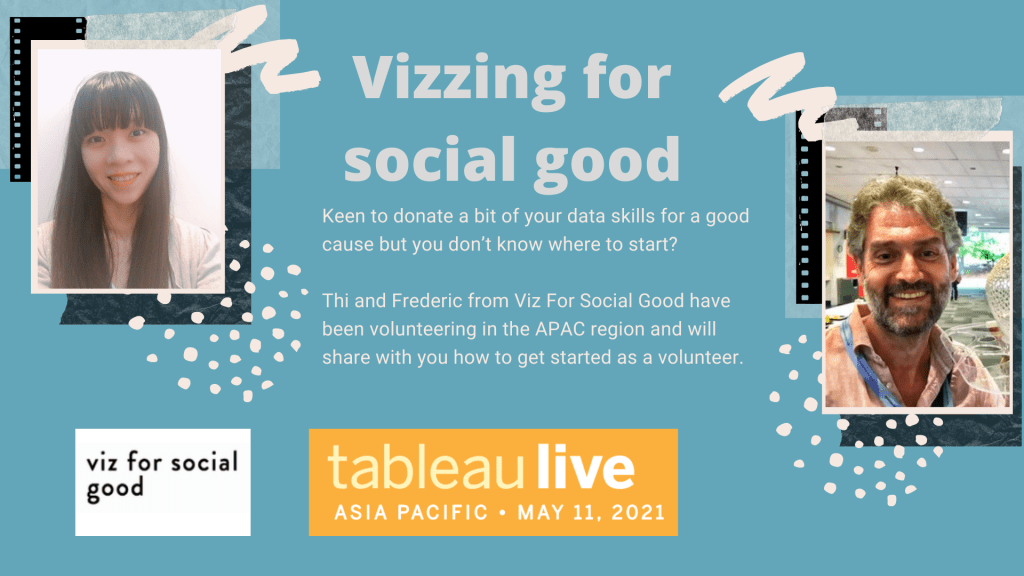
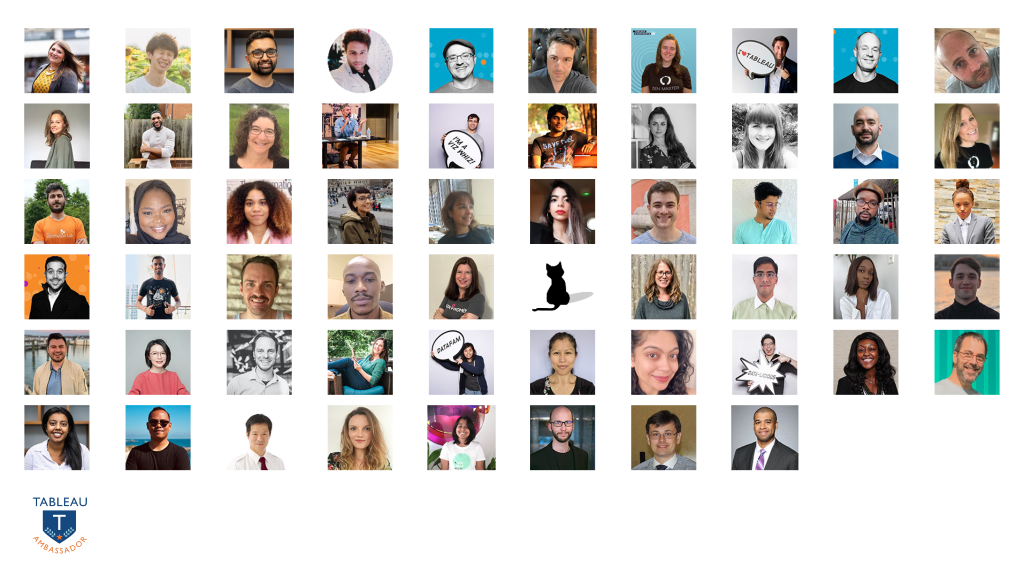
Tableau Ambassador
This says it all. I have only been using Tableau as a hobby since I discovered it in 2016 (my first Tableau light bulb moment).
I LOVE+++ the Tableau community (I wrote many times about this) and can’t thank you all enough for your moninations and support!
It is such a great honor to be part of the Ambassador group and help the community grow and thrive.
Data Do Gooder
The Tableau World Podcast loves to recognize the Tableau community. This year, as part of the Tableau Conference, the 7th Annual Vizzies recognised many great data community members. I was so honored to have won the Data Do Gooder award. I will happily take the awards, but I really see this as a team effort. Thanks to my fellow Viz For Social Good Leadersm community members and volunteers.
By the way, please check out our latest Viz For Social Good project.

First gig for the Tableau Service Corp
I have been a volunteer for the Tableau Service Corp for a couple of years but have “not been very busy”. We bascially wait for orgs to contact you for help! I got my first real help request this year and that was really great to assist Joe from the New Zealand AIDS Foundation.

Advent Calendar
It was cool to make the advent calendar this year. Thanks Matt! Yes I love to do good with data and more so, I love to inspire others.

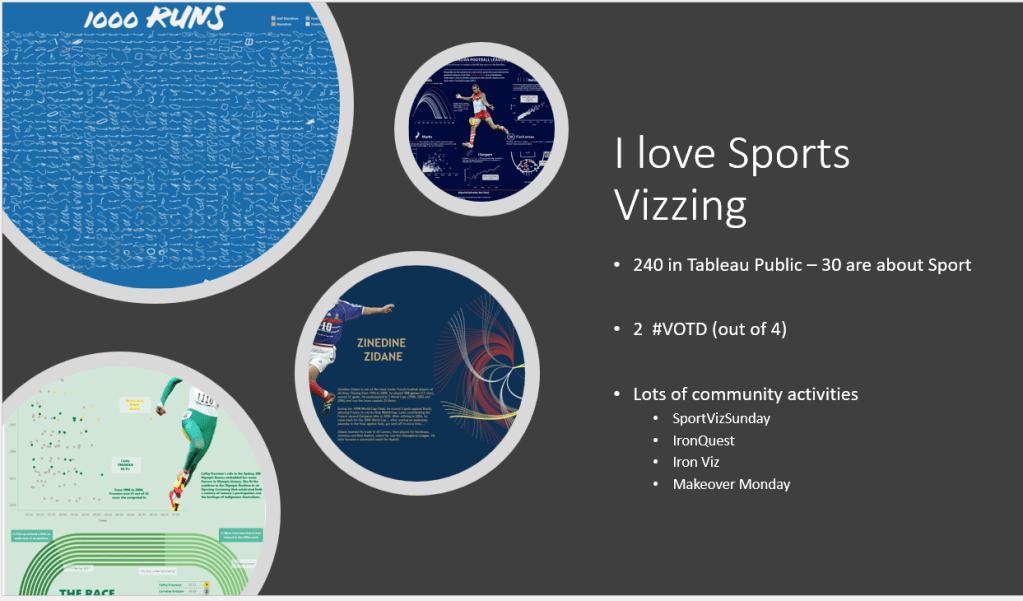
Show Me the Data in Sport
I love sport datavizzes, this was great for me to share my passion and may be inspire newcomers. Show me the data in Sport was a Tableau webinar that showcased great use cases of visualising sport data.
Brisbane TUG Lead
I love community building. As the Co-Lead of the Brisbane Tableau User Group, I really love finding great presenters and invite them to share their stories. TUG leadership is hard, as it is not easy to find presenters, but it is so rewarding! Want to talk next, contact me!
Guest lecturer at my local University QUT
I also really enjoy teaching Tableau for QUT’ Business Intelligence Unit. We also run a mini Viz For Social Good program, we partner with a local charity that provides data for students to get insights.
Big W Data Visualisation Manager – “Real Tableau skills”
And last but not least!
I discovered Tableau in 2016, feel in love with the datafam community after I discovered MakeoverMonday but had been using Tableau as a hobby only.
My background is in comms and marketing, not data, but since 2016 I often aspired to get a job relating to Tableau and data visualisation.
This year in October I was lucky to start working for Big W Data and Insights team as a Data Visualisation Manager. I develop Tableau dashboards, create shared data sources, help run internal Tableau training and Tableau doctors sessions for our business users and help the organisation with its self-service analytics mission.
I’m part of an awesome team and I learn a lot…learn “real Tableau skills” as someone told me.
I can say with confidence that the Tableau community with its many initiatives, Tableau Public this amazing platform to showcase your work, and the generous support received from the community helped me to get where I am now.

Happy new year and see you all in 2022 for more data vizzing.
Featured image CC @@josh_tapley VizinReview

Leave a comment