This is with great honor that I was invited to judge again the QUTBands Hackathon. QUTbands is the QUT student club for aspiring Business Analysts, Data Scientists.

Before the live presentation, which was the event I was invited to judge, students attended a Tableau Desktop and Tableau Prep Builder training session delivered by keyData. They also attended a data visualisation and story telling workshop delivered by Kate Norris from Presentation Boss.
Data: Happiness
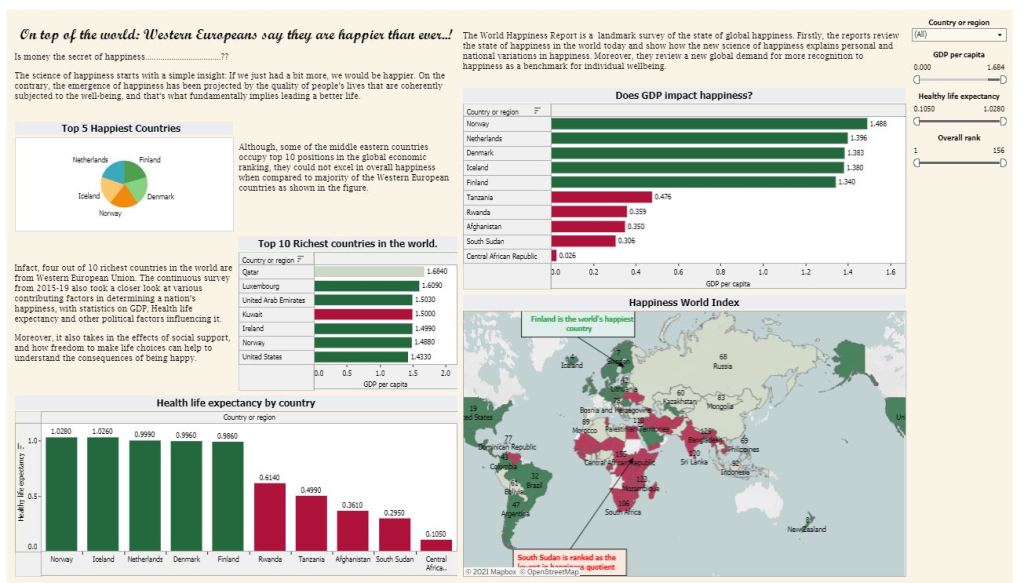
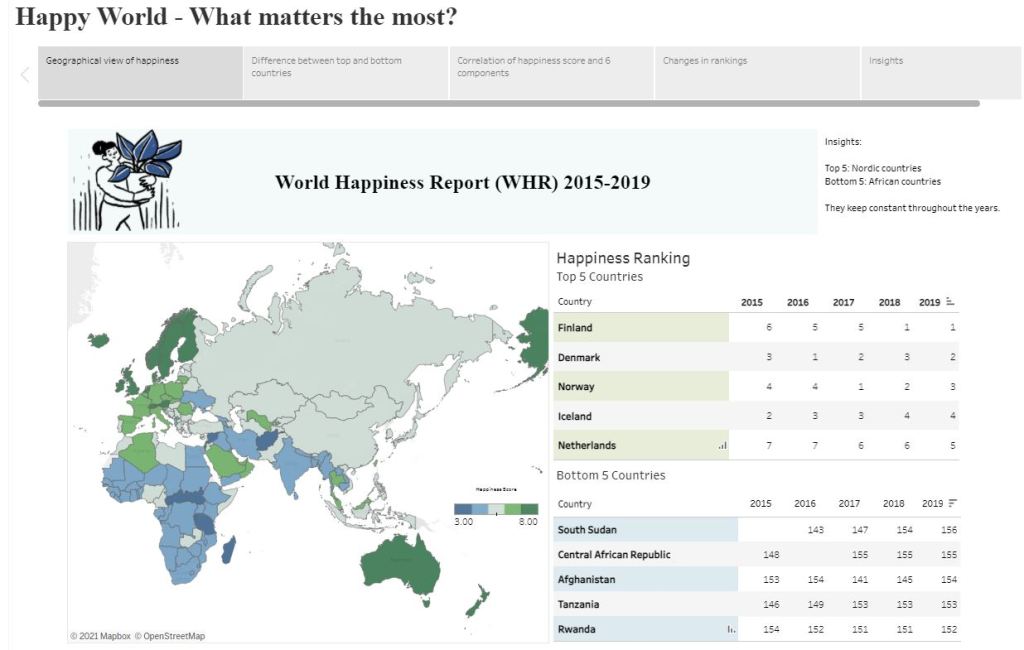
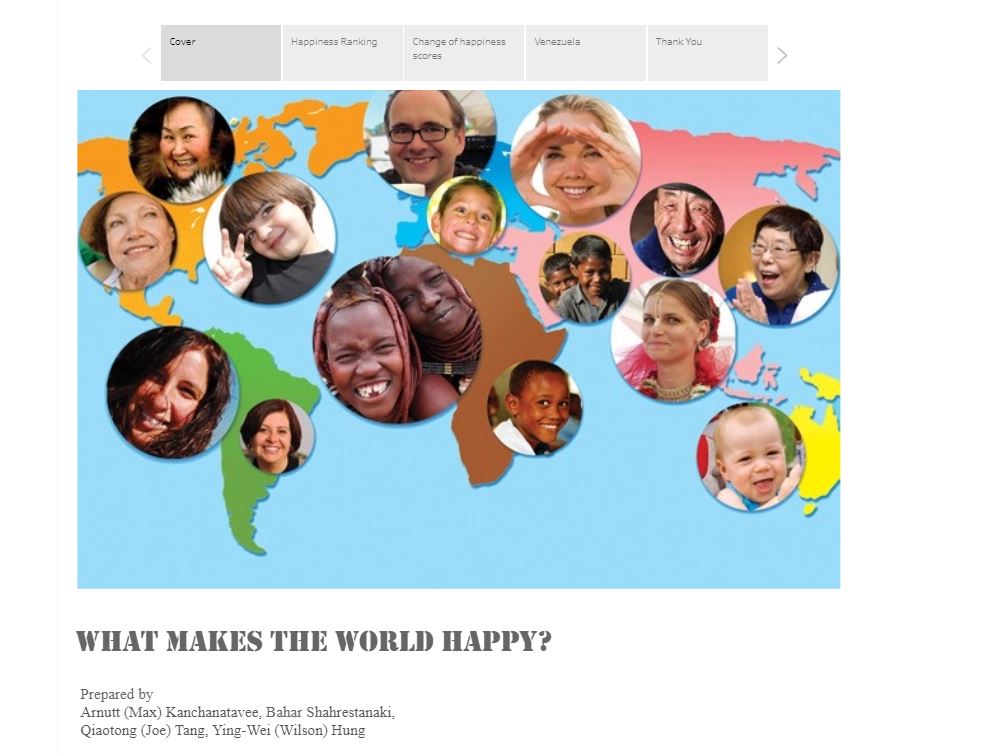
The theme of the datathon was happiness. Using The World Happiness dataset, students had to imagine they were a policy maker who was going to develop a proposal to a world-wide organization about the happiness situation of countries in the world.
They had to use the dataset provided (and any other relevant datasets), build a Tableau dashboard or story, find relevant insights and present their findings in front of the group during the hackathon live event.
Students were in teams of 3 to 4 and had access to the data and problem statement about 10 days prior to the live event.
All teams had to pitch in front of the panel of judges, 5 minutes each. The first winning team would receive an internship opportunity with Keydata.
This was meant to be an inperson event, but due to the Brisbane 3-days lockdown, the event had to turn to virtual only. Congrats to the organisers and students for pivoting so easily.
The 8 teams submissions
| Team name | Link to Tableau Public | Position (only first 3 teams are in order based on their scores | |
| Tableau Hackers | Link | Champions!! | |
| Happy Hackers | Link | First runner-up | |
| The Outliers | Link | Second runner-up | |
| Another Day, Another Data! | Link | ||
| Team SEG | Link | ||
| HHK | Link | ||
| Bot-Sqad | Link | ||
| Happy Pie Face | Link |
My impressions:
Assuming that all students were pretty much all beginners, their work was quite impressive, well done all.
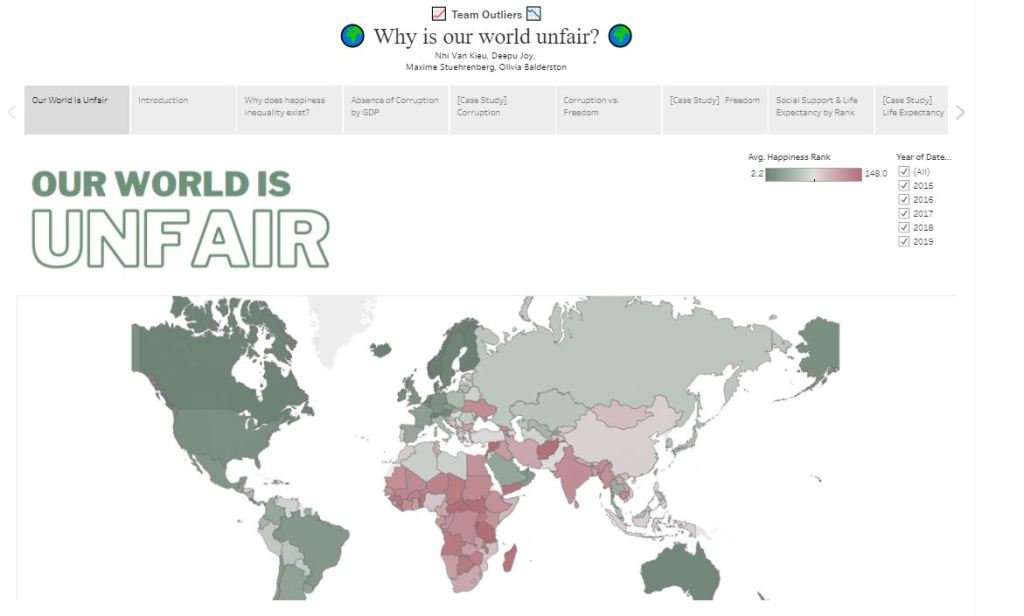
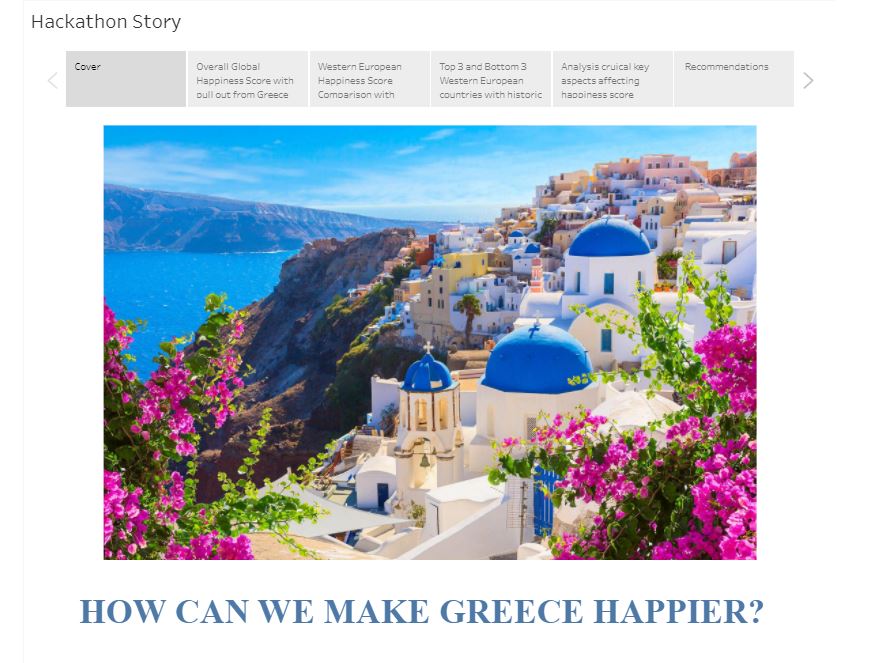
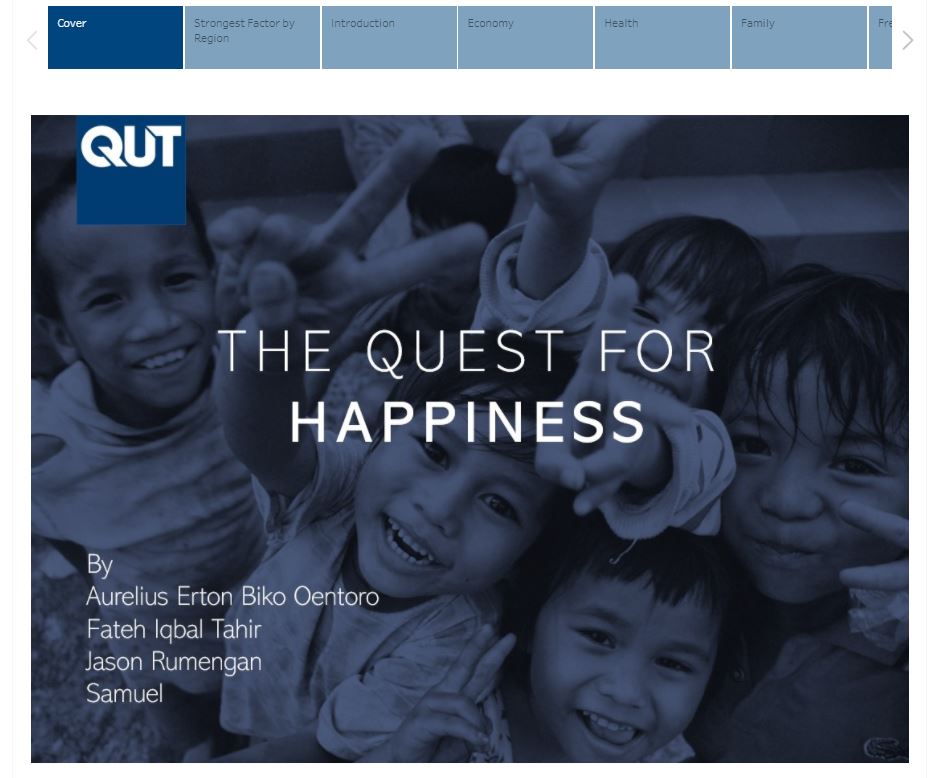
- What I found interesting was most teams (6 out of 8) decided to use Story rather than a dashboard. Would this contribute to my other points below?
- The teams that had most success kept it simple. For example the winning team used one type of chart only, produced a nice consistent design and delivered a powerful story and insights. So I wonder if Story (like Powerpoint) is pushing students (involuntary) to cram too much in their presentations?
- The teams that had practiced were more in control I felt.
- A few teams, tried to use too many charts or text in their stories. You could feel they were struggling a bit to finish their presentations and their key message/insight was a bit lost. Keep it simple!
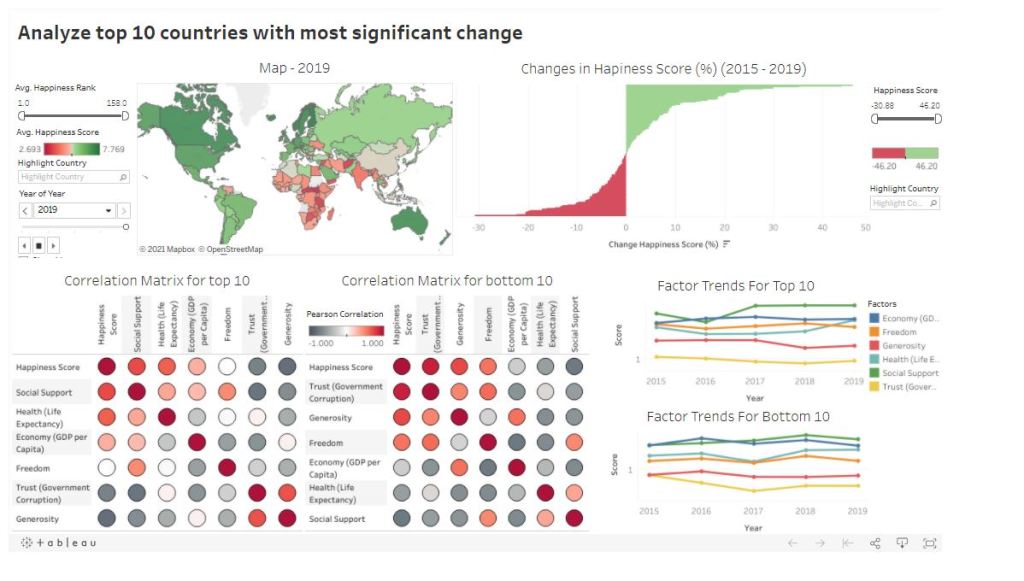
- Many teams used maps (the data had countries), which was tempting. Sometimes a good old bar chart works better than a busy map with lots or red and green!.
- I had offered in the datathon slack channel, to give feedback to the teams before the live presentation. Only two teams took on the offer, I imagined more teams would have done so. I often say that asking for feedback is important, dont be shy!.
The other judges, Dave Keys and Kate Norris had also very insightful feedback (I wish I wrote these down!). Keep is simple and focus on the main insights were the key takeaways.
I hope this is only the beginning of the students data journey. Data visualisation is not easy, it takes time and practice.
I advised students to keep on practicing, join a data community activity (Makeover Monday), ask for feedback, keep it simple.
Refer to my previous blog post “How to get started with data visualisation and Tableau as a beginner?” about this topic.
Finally, well done to the QUTBands organising team Alice, Tamara, Juhi and Aparna, you did an amazing job!

Leave a comment