
On 19 March 2020, 35 Brisbane Data enthusiasts got together to help Sunny Street make a bit more sense of their data. Read about the full wrap up here
This was the first ever Viz For Social Good event in Brisbane and Australia.
Below is the Top 5 vizzes selected by Sunny Street (not in order)
| Tony Hartigan
|
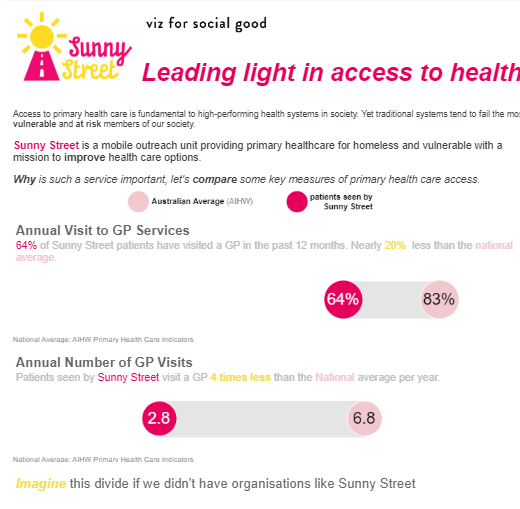
“Shows the data in the simplest but most appealing way, and really love how he has framed things. Sunny Street Colours, and really with the viewpoint of letting people understand our work and tugging at heartstrings LOVE LOVE LOVE these simple but powerful visualisations” |
| Sharna Bourke
|
“As I said in initial feedback: hit the nail on the head regarding the public health statistics and adding a monetary value to our service vs not having it – really cool. Would love to see more of our data compared with national health priority areas and with a monetary value added.”
|
| Samantha Gonsalves
|
“Samantha’s viz has some really interesting stats and some of the most helpful ones are presented very nicely. I like that she is one of the few that focussed on referrals – because when we work together we accomplish lots more! And simple easy to read graphs etc.”
|
| Kelly Harrison’s
|
“Kelly Harrison’s viz gave us beautiful insight into volunteer wellbeing and how we can quantify those campfire measures too, which was eye opening. We are very passionate about our volunteer’s loving what they do and being provided everything they need, they shaoe our service – so we love what Kelly has done here”
|
| Robert / Cogniom’s
|
“Robert / Cogniom’s viz is a beautiful visualisation of the Sunny Street Cogniom Study. It shows that there is absolute value in continuing to collect this data, and it will go towards shaping what the next set of studies looks like. We also love your work guys!”
|


Again, well done everyone!

Leave a comment