In this Makeover monday week 45, we were asked to visualise Life Expectancy at Birth by Country data from the World Bank
My plan:
As I try to learn new Tableau tricks I decided to follow Andy’s tutorial to create Small multiple line charts, also adding dynamics labs following this tutorial from the Info Lab
The result was ok but I don’t think it worked very well, I guess too many countries!
See below vis

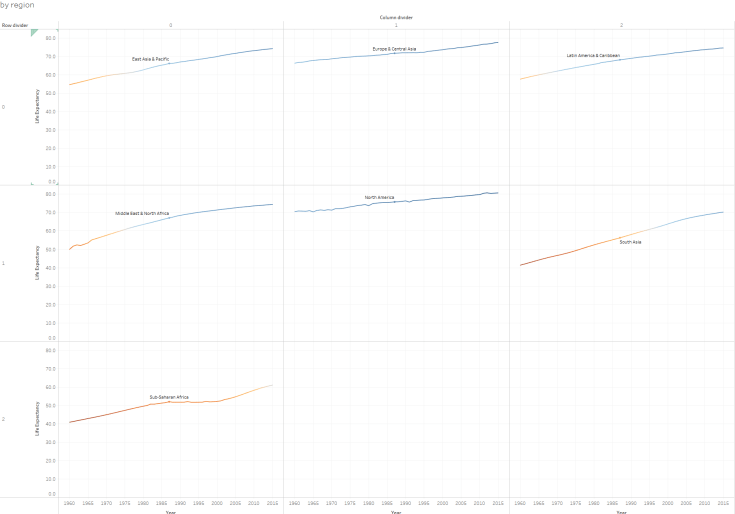
Then I tried to group by region, but still not what I wanted, in terms of story telling…
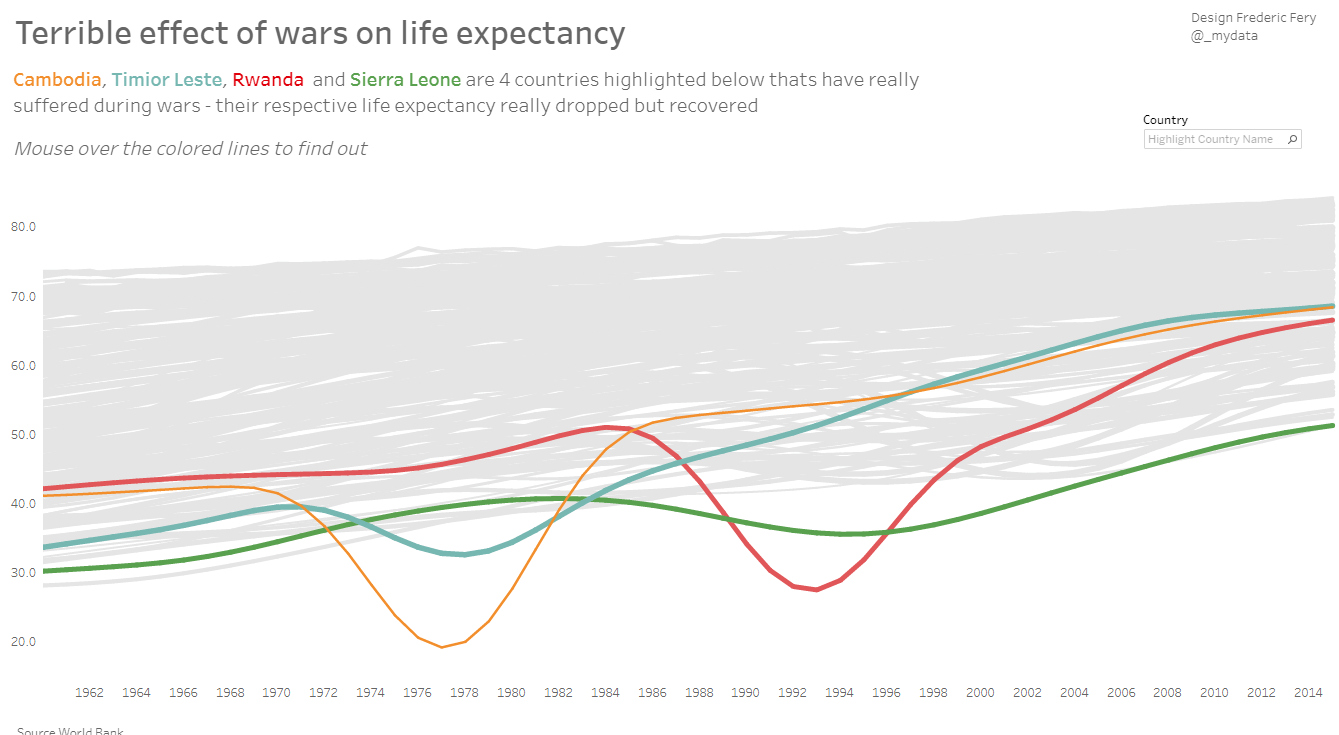
Then almost by mistake, I changed the vis to focus on the effect of wars on the life expectancy of 4 countries – for me this vis works better at story telling.
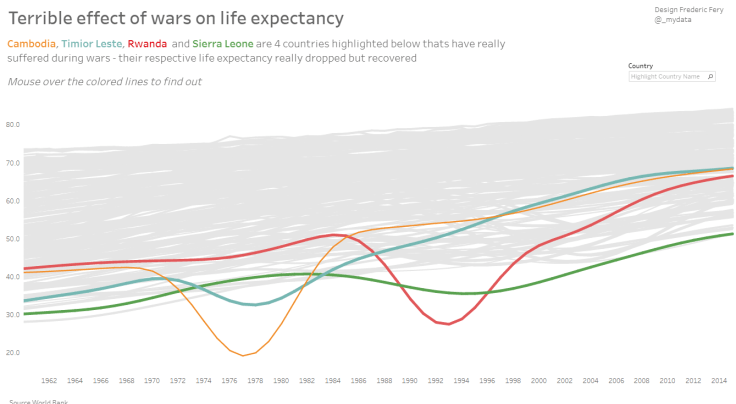
and the other issue was to bring the colored line to the front. Again thanks Andy for the pointer (I had to sort them)

Leave a comment