How did this collaboration start?
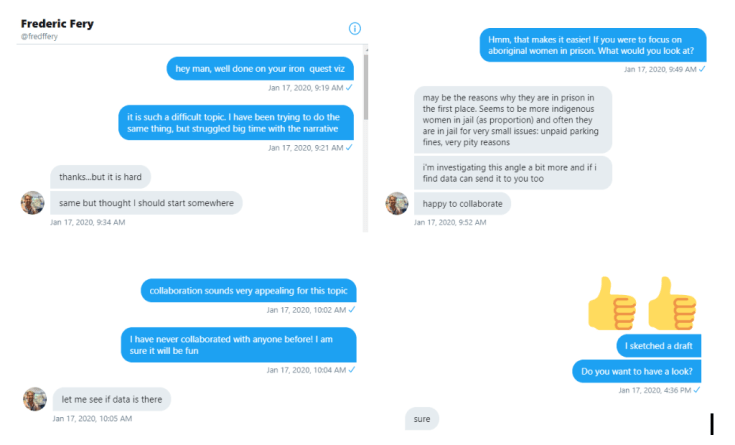
It started on Twitter on 17 of January when FN (Fred Najjar @FredrickNajjar) send to FF (Frederic Fery @Fredffery), “hey man, well done on your iron quest viz” …. then a few messages and Thumbs up later, FF sent back, “happy to collaborate”, we are in..
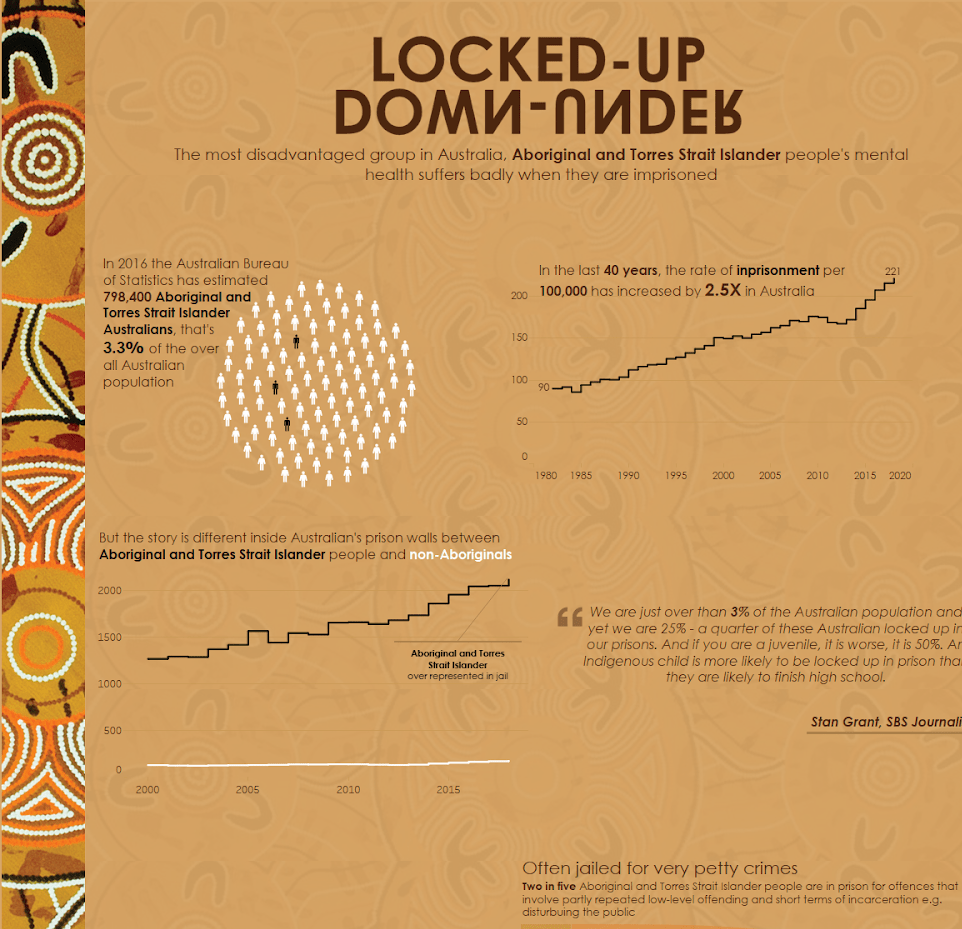
That’s it, the coalition of the “Australian Freddies & Fredos data vizers” started, it was very simple and we both were excited. We agreed to work on a collaborative #IronQuest #ProjectHealthViz project, the theme being Healthcare in prisons.
“Some geo context, FN is from Sydney and FF from Brisbane in Australia. Same country, time zone, so pretty simple to collaborate.”
The environment:
- Created a Slack Channel for the chat (ironQuest Freddi and Freddo) don’t ask who’s who!
- Created a Google Drive folder to share the work and multiple versions (11 versions)
- We started by creating a fakeTableau Public user to publish our versions and compare, then discussed using Bitbucket data repo – way too tech – so it sounded too complex, at the end, we agreed to save the version in Google Drive using a file naming convention so we don’t overwrite each other’s work (eg filename FF V1 date, filename FN V2 date…)
- Collaboration rule #1: Agreed that FF works early morning and FN works at night
- Collaboration rule #2: NONE…just have fun!
Planning:
- FN has been already working on his version, he had hand-drawn sketch (show mockup screenshot) which he shared with FF
- FF and FN started to bounce ideas for chart types, stories, visuals, messages. It usually involved one of us creating a duplicate of the previous workbook, mock the idea up, or ask questions, then the next person will take over with more ideas, comments.
- That was the very fun part of the process…
- 11 iterations over the 2 weeks
At some point during the collaboration FN got caught up with some personal commitments, he went quiet for a day or two during that time. During this time FF started working on the layout, included some colours, design elements and “quotes”, and when FN got back on board, he naturally was able to pick up where FF left. When the night owl shift was due FN worked on the formatting, charts, story points… the whole thing seemed to flow very well…
On the next day, FF – during his early bird shift – was very happy with the outcome. But had to do ‘some’ spell checking afterwards….

About the data:
Where did you get the data from?
Unfortunately, the Australian Bureau of Statistics (ABS) is not as comprehensive as in other countries, pretty much all the data is rolled up to a summarised version and/or don’t exist! However, FN did his research and managed to find some data from ABS and other government bodies (inc a scanned pdf version from 1997 about Australians Social Trends) related to this matter. FN later used Alteryx to stitch this data together.
Was it hard to collect this data?
When FN was on the hunt for the data, he ended up with loads of information and facts, at first, this information was overwhelming and hard to untangle. But when FN and FF agreed on the storylines, it was easy to figure out what data to include and what to exclude
What resources did you use?
FN mainly used Google data search engine and the Australian Bureau of Statistics (ABS) at first to get facts about the Australian Prisons Healthcare. However, later on, when FN and FF were working on the story points more data was required to reflect the story they intended to show
Did you find all the data you needed?
Almost, FN and FF had an idea to include a story that occurred in Don Dale youth detention centre in Northern Territory >Read About What Happened Here< but due to the lack of information and available they decided to drop that story off.
The decision behind the collaboration:
Why did you want to start a Tableau data Viz collaboration?
FN: I had this idea for a while, I wanted to collaborate with someone from #datafam, as I was curious about what this collaboration would look like.
When I first saw FF’s #IronQuest entry, I instantly reached out to him on Twitter saying ‘well done’ and told him that I was investigating a similar topic for my iron quest entry – Aboriginal and Torres Strait Island people’ healthcare in prison – but I was struggling to put a narrative to my viz! FF was kind enough to offer to collaborate, I didn’t hesitate at the time and said ‘yes’ straight away.
FF: As Tableau data visualisation is only a hobby for me, I do my work alone. I often get my wife and kids to do a sanity check (incl spelling) but I thought that was an awesome opportunity to develop something from scratch with someone remotely. I also Viz a lot about Aboriginal and Torres Strait Island people issues, and I appreciated a fellow data vizer interest.
Learning:
What did you learning during this collaboration?
FN: When FF & I agreed to collaborate, I already had sketched a version on my iPad. But, I kept on getting this feeling that something was missing! FF liked what I did after sharing the sketch with him, he added a few points made and we discussed some more metrics. Here I started getting excited about this collaboration, as we both were passionate about the project.
I instantly started working on the graphs, got my Sankey and Pudding charts sorted, then created all other charts that we discussed. But then I started to have the challenge on how would I put all together… I uploaded my v1 workbook to
FF: We set up some sort of process, in a very open discussion. Ideas were sent back and forth constantly – lots of creativity and lots of respect.
What worked well was FN was working at night and myself early in the morning, so we had time to exchange ideas and iterations. I’m not a back end or data person, FN brought a few chart type (eg Lindsay Plum Pudding Chart) hat I would not have created on my own., so I learned a few more technical tricks.
Challenges:
What did you find challenging:
FN: Everything about the collaboration seemed natural to me! But we had a few hiccups when it came to version control and narrative. Also, the shift work was good at the beginning as this made sure we are not overwriting each other’s work. However, it got to a point where we had to write essays to explain our thoughts to each other. But once both of us got on board with the storylines, this take became very easy.
FF: It is easy to do a live collaboration with a Word doc or Powerpoint file, not with tableau and multiple data sources – there is no shared environment, but if you come up with the process, toolbox it should be fine. Also, the publishing process is a bit tricky ie, who is publishing the viz? You don’t want to 2 authors to publish a duplicate? Maybe having a Co-Author option would solve this issue.
Feedback:
Would you do it again?
FN: Without a doubt, I enjoyed working with FF he was very understanding with my limited time – juggling between personal commitments and demanding job – I also learnt a lot from his amazing work and ability to articulate the story behind the viz. This project has shown me another way to do things. And most importantly I have made a new #datafam and a friend which I promised to visit in Brissy sometime soon
FF: Yeah for sure, any time. It is an amazing opportunity to learn, improve your storytelling or technical skills and make new data friends.

Viz URL tinyurl.com/v5f76c2
Credit:
Ken Flerlage @flerlagekr for his amazing Sankey Template blog
Lindsay Betzendahl @ZenDollData for her blog on How to Create a Plum Pudding Chart
Sarah Bartlett @sarahlovesdata for running Iron Quest – Healthcare in Prisons
