On the 8th of March 2018, 80 cross-discipline QUT students came together to tell stories using the data software Tableau.

Tableau is a business intelligence software that transforms data into actionable insights. Data presentation is a skill in high demand, having recently been identified by Linked In as a top skill employers need most in candidates.
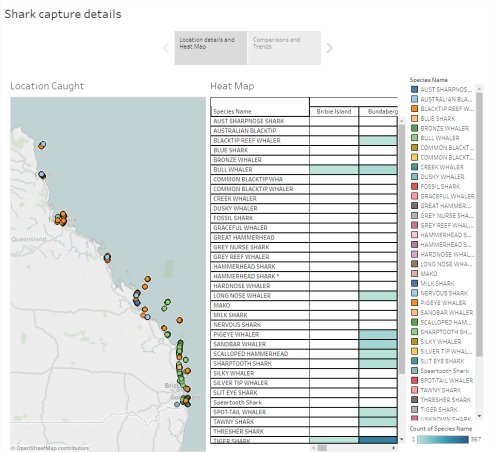
The day was divided into an initial three-hour training session, followed by a data visualisation competition that challenged students to create a story based on Shark Control Program data set. (download dataset and further readings here)
KJ (Twitter) and Chris from the Tableau Academic team delivered a very interactive Tableau Power Up session with the help from Sam (Twitter) from Key Data.
Eighty students were divided into teams, given access to the data set, and had about an hour to develop their stories using Tableau.

Teams then presented their visualisations in front of the judges and were marked based on three criteria:
- Story telling
- Analysis techniques
- Design aesthetic
The 4 judges were two QUT staff and two industry partners:
- Lisa Bradley – QUT Business School
- Debbie Henderson – QUT Chief Data Officer
- Rob Baltrusch – Deloitte
- Sam Batchelor – Key Data
The judges were impressed with the quality of the presentations and techniques used to tell a story with data in such a short period of time.
The winning team comprised of Elliott, Brodie, John and Haroon, called their team “These Stats Aint Loyal” and used the shark data set with great humour.

Winning team visualisation URL

Team KKTS came close second, just two points behind the winning team; well done Kenneth, Karthick, Tim and Stephen.

Second team visualisation URL
Students also had the opportunity to vote for their favourite teams. People’s choice Prize was awarded to team “Fish Friends”, Susana, Alex, Tim and Saban.


People’s choice prize visualisation URL
Taking a bit of a risk, I decided to announce the winners via a live Tableau dashboard (live vis URL), which worked out in the end.

“Feedback from students was overwhelmingly positive, with students calling the event “interesting”, “fun” and “thought-provoking”.
Photos credit and MC of the day: Marvinfox.
If you are planning to organise your own session:
If you are a University student, a Tableau Ambassador and want to share your Tableau love and organise similar kind of session, these are a few points to get started:
- At your own university, find out if there are students clubs or students societies. Data Science, IT or maths societies might be keen to help you organise extra curriculum activities. They will help with the logistics of the event and use their network to promote the event.
- Reach out to the Tableau academic team, they will know if such events have been organised before. They might have the resources to come on campus and deliver the test drive training. They might also know if academic staff/professors are using Tableau in their curriculum. They might also be able to give you a few swag/prizes for students.
- As per above, try to find out if a Professor at your local university is using Tableau in their curriculum. Then you could propose him/her to organise an extra curriculum (no assessement, just for fun) activity.
- In your own city, find out if member of the Tableau community (Zen Masters, Ambassadors…) are active and would be willing to give you an hand. Check the Tableau Ambassador page or even the Datafam finder viz.
- In your own city, find out if there is a Business Intelligence/Data or Tableau partner firm. They might be willing to come on campus and deliver the training, be the judge of the competition and even sponsor.
- Find the structure and format that works for you and students. For the sessions I had organised, we had 3 hours of Tableau training in the morning, lunch, then we put students in groups of 3 or 4, gave them a data set and 3 hours to create a data story. The last hour of the event was for students/team to present their work to the panel of judges. Then prizes…

hendo rocks!
LikeLike