
Makeover Monday week 41 was about visualising Adult Obesity in the United States. (data)
My initial thoughts:
It would have been very fun to do this during the live Makeover Monday at #data17 but I don’t think I would have time to learn much.
So I took this opportunity to learn new Tableau tricks.
I decided this week to learn about making a Tableau Hex tile map thanks to this useful post from Rachel Costa from The Information Lab.
It was a little tricky and with a bit a searching online it worked out ok.
What I have learned?
- Americans are fat, ok I already knew that
- I learned how to make Hex tile map and use dummy calculation
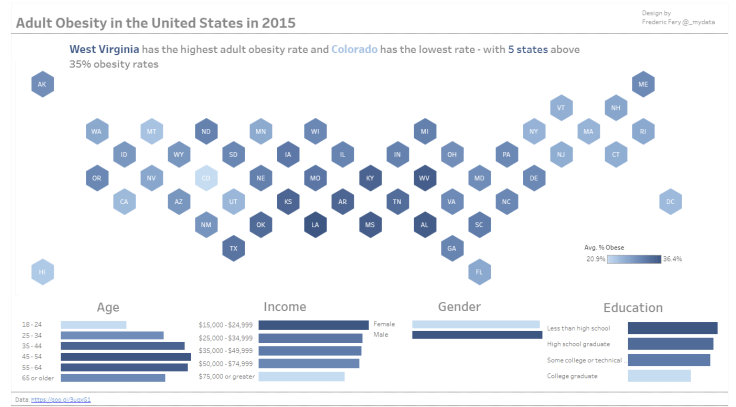
Thanks to this post, I have also learned how create a color scale that separates data into separate range ranges.
My Second vis is:


Leave a comment