
Tableau 2024.3 new feature, Spatial Parameter, allows you to analyse geographical data based on location and distance relationships. In this guide, I’ll walk through creating a radius-based spatial analysis dashboard similar to the sales analysis example I created. (Tableau Public link)
I was inspired by Tableau Tim video to learn more about this new feature.
Also, Don Wise, in the Tableau Forums unlocked a few critical elements with the dataset setup, feel free to check the thread here.

Prerequisites
- Tableau Desktop or Tableau Public
- Two datasets containing:
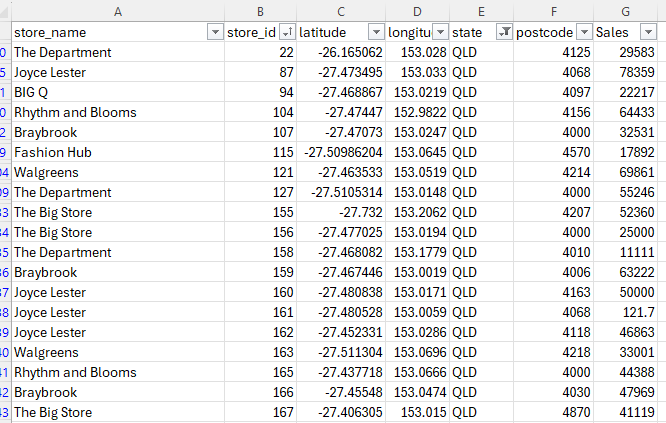
- Primary dataset with store information (postcodes, latitude, longitude, sales, store names/locations)
- Secondary dataset with geographical reference points (postcodes, state, latitude, longitude)

Setting Up the Spatial Functions
1. Creating the Point Geometry
First, we need to create points from our latitude and longitude coordinates:
// Post Code Geometry
MAKEPOINT([Latitude],[Longitude])
This creates a spatial object that Tableau can use for geographical calculations.
2. Implementing the Buffer Function
The buffer function creates a circular area around our point of interest:
//Buffer
BUFFER([Selected Spatial Parameter], [Radius], 'km')- Selected Spatial Parameter: The point geometry created in step 1
- Radius: A parameter that controls the size of the buffer (e.g., 15km)
- ‘km’: The unit of measurement
3. Setting Up the Intersects Function
To determine which points fall within our buffer:
//Intersects Buffer?
INTERSECTS([Buffer],[Post Code Geometry])
This returns True/False based on whether a point falls within the buffer zone.
Creating the Interactive Elements
1. Spatial Parameter Setup
Create a parameter with:
- Data type: Spatial
- Allowable values: List
- Add your key locations (e.g., Brisbane, Sydney, Melbourne)
- Use WKT (Well-Known Text) values for precise coordinates – I used this tool to generate the POINTS.
2. Radius Parameter
Create a floating-point parameter for the radius:
- Set a reasonable range (e.g., 1-50 km)
- Add a step size (e.g., 1 km)
- Make it user-friendly with a slider interface
Building the Visualisation
- Base Map Layer
- Start with a map view
- Add your Post Code Geometry, Store ID, Store Names if required
- Size/color points based on sales data
- Add the Intersest Buffer calculation (set to True)
- Buffer Layer
- Add the Buffer calculation as a separate layer
- Set transparency to maintain visibility of underlying map
- Use the buffer calculation to filter points
- Sales Analysis
- Create a bar chart showing sales within the buffer zone
- Add the Intersest Buffer calculation (set to True)
Best Practices
Data Management, as per Don’s advice in the Forum reply
- Keep spatial data sources independent
- Use identical calculation names across data sources
User Interface
- Provide clear instructions
- Add tooltips and filters for additional context
Conclusion
Spatial analysis in Tableau provides powerful insights into geographic relationships in your data. By combining MAKEPOINT, BUFFER, and INTERSECTS functions with interactive parameters, you can create dynamic visualizations that allow users to explore spatial relationships in your data effectively.

Leave a comment